Leighton Moss South
Bat Call Microphone
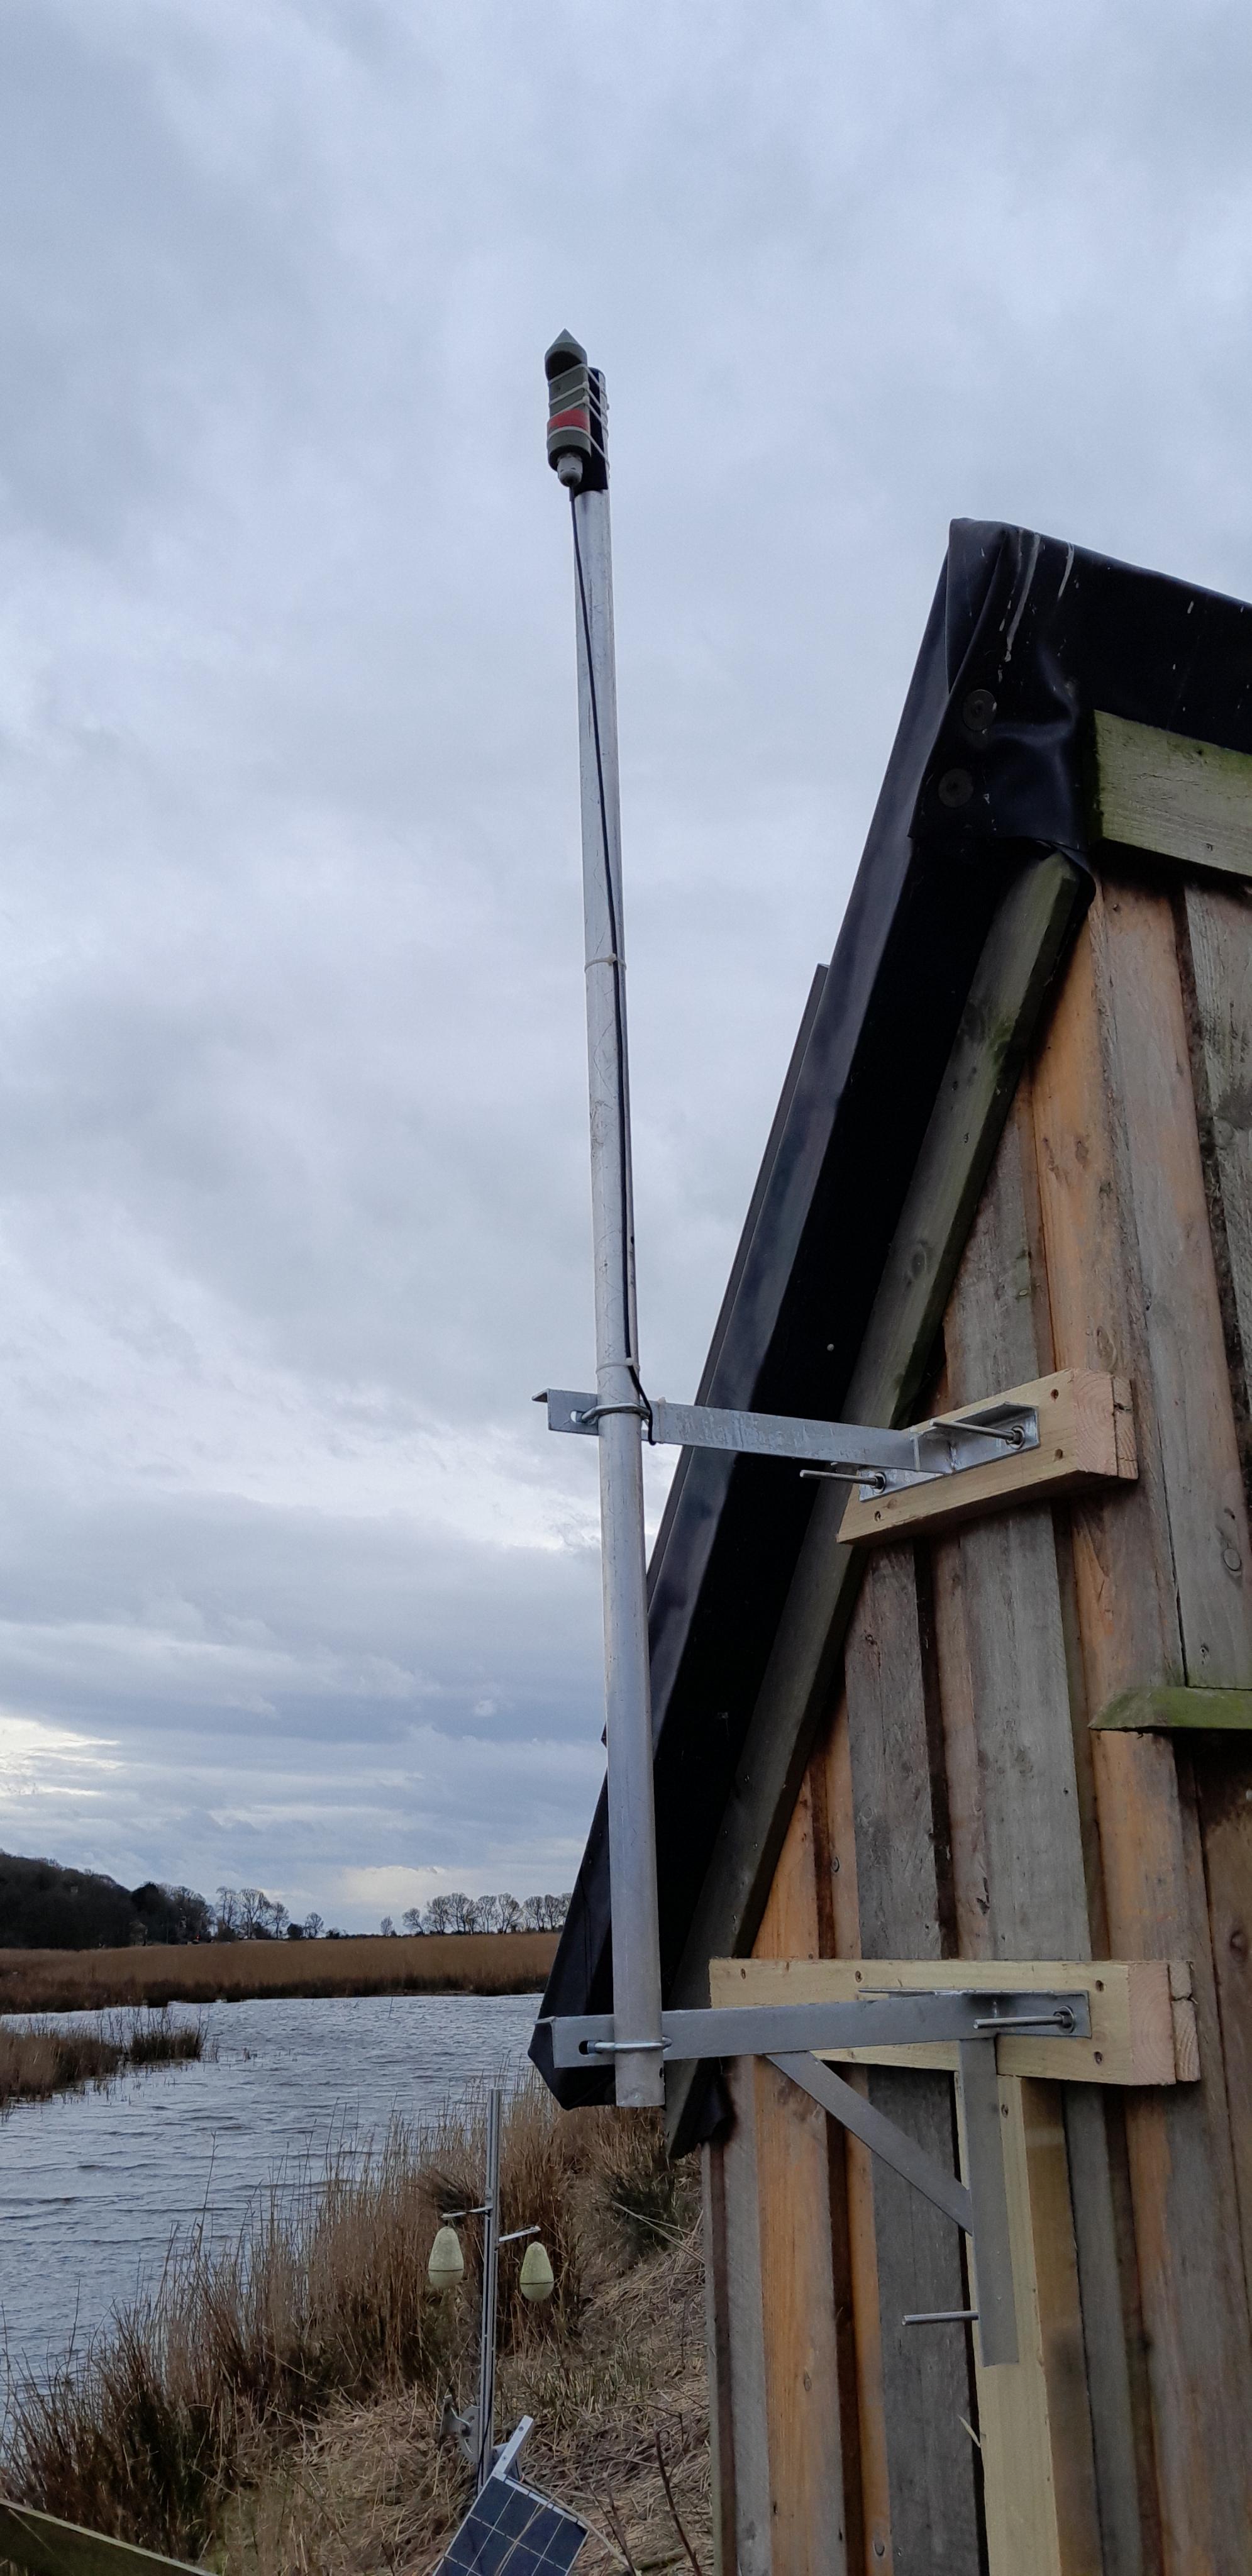
The equipment used to record and identify bats is located at the south of the main Leigthon Moss reserve.
As can be seen in the image, the microphone used to detect bat calls is mounted at the top of a pole, which is in turn attached to the solar shed. All the associated electronics are located in the shed.
The sampled acoustic data are processed using the batdetect2 machine learning model to identify bat calls. Results of the call detections, are then plotted on various graphs and presented on this website. It is important to note that the results of the machine learning model, should be treated with caution, as spurious results are always possible.
In addition to the bat call data, weather observations are also plotted from a weather station local to the bat detetctor. This is to allow for comparision of bat behaviour against weather conditions.
Note that if no data has been recorded for the time period of the plot, no data will be shown in the plot.
These plots show the total number of calls counted for the selected species on each night.
The call count as above but expressed as a percentage of all the calls counted in the time period. For example a value of 50 means 50% of all the calls for that species counted occured on that night.
In addition, in the key the total number of calls made by each species, in that time period, are show in the legend.
These are a scatter plot of the times at which a bat calls, time is +/- midnight on the selected nights.